
I’ll be honest with you — I spent years running my agency without really knowing my numbers.
I knew roughly what was in the bank. I had a feel for whether we were busy or slow. But actually knowing the numbers that determined whether my agency was healthy or slowly bleeding out? Not a clue.
It wasn’t until I started tracking the right metrics consistently that everything clicked. I could see problems before they became emergencies. I could make decisions based on data instead of gut feel. I could actually build something sustainable instead of just grinding month to month.
I now take those same metrics and help my private agency coaching clients get them for their agency, so that they can hit their growth goals as fast as possible.
Below are the 14 numbers I now track religiously in my Agency Growth OS. If you’re running an agency and you’re not watching all of these, you’re flying blind.
PS: the Agency Growth OS is only available to my private coaching clients. If your agency isn’t growing, and you don’t know why, schedule an intro call and we can chat about it. I’m filling up my Fall 2026 1:1 clients currently.
1. Contracted MRR (Monthly Recurring Revenue)
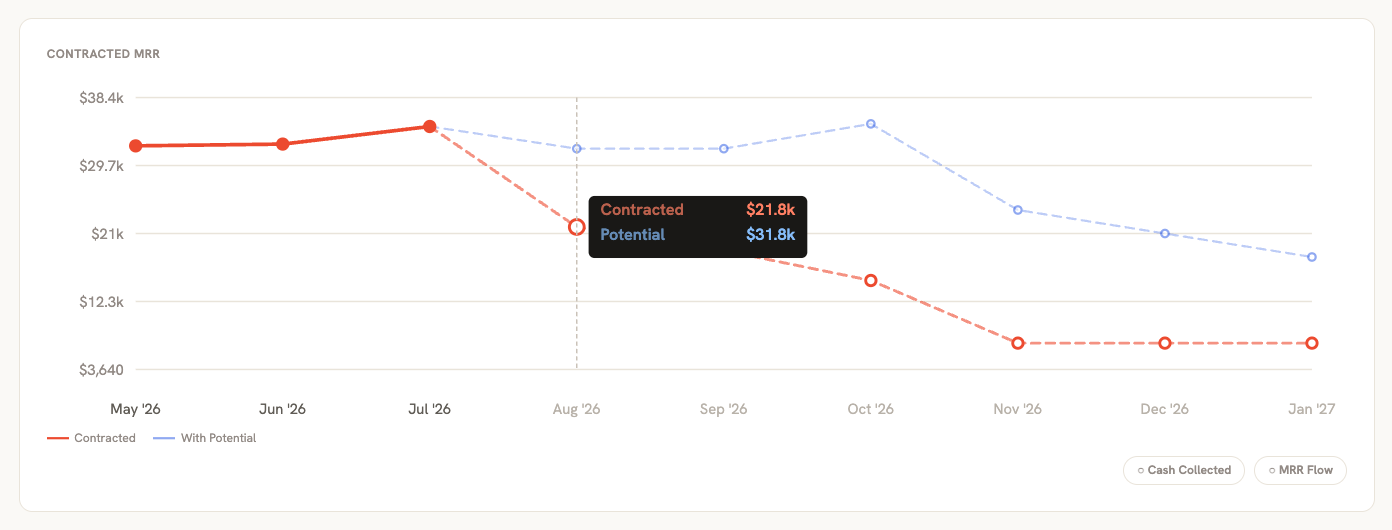
What it is: The total value of all your active recurring contracts, measured monthly. Not what clients might pay you — what they’re contracted to pay you.
Why it matters: This is your foundation. It’s the number that tells you whether your agency is stable or whether you’re living month to month in feast-or-famine mode. Contracted MRR is forward-looking — it’s what you’ve already sold and are owed. When this number grows consistently, you have a real business. When it’s flat or declining, you have a problem that no reasonable amount of new leads can fix until you solve your retention.
How to calculate it: Add up the monthly value of every active retainer or recurring contract you have right now. If a client pays $3,000/month and is on a 6-month contract, they contribute $3,000 to your Contracted MRR.
The formula:
Sum of (Monthly Value × Active Status) for all client contracts
Benchmark to aim for: Growing 5–10% month over month is healthy. Flat for more than two months in a row is a warning sign.
2. Revenue
What it is: The actual cash you collected (or invoiced, depending on your accounting method) in a given month. This includes recurring retainers AND any one-off project work.
Why it matters: Revenue is what you actually brought in the door. It’s different from Contracted MRR because it includes project work that isn’t recurring, and it reflects what you actually invoiced rather than what you’re contracted to receive in future months. Watching the gap between Revenue and Contracted MRR tells you how much of your income depends on finding new project work each month — the higher that dependency, the more pressure you’re under.
How to calculate it: Total all invoices sent (or payments received, if you’re cash-based) in the month. For extra points, break it down by MRR vs one-offs to see the split.
The formula:
Sum of all payments received in the month. Do not include invoices sent but not collected.
Benchmark to aim for: You want Revenue growing in line with Contracted MRR, and you want to reduce your dependency on project work over time. Aim for 70%+ of revenue from recurring sources.
3. Gross Profit Margin
What it is: Revenue minus your direct delivery costs — the people and tools directly involved in doing the work for clients.
Why it matters: Gross Profit tells you how efficiently you’re delivering your service. You can have great revenue and still be barely breaking even if your delivery costs are out of control. This is the number agencies with high headcount tend to ignore until it’s too late.
How to calculate it: Revenue − Cost of Goods Sold (COGS). COGS includes contractor costs, freelancer fees, software tools used for client delivery, and the salary portion of anyone whose job is client-facing delivery.
The formula:
Revenue − Cost of Goods Sold (COGS)
Benchmark to aim for: Most agencies should aim for a Gross Profit Margin of 60%+. Below 40% means your delivery is costing you too much relative to what you’re charging.
4. Net Profit
What it is: What’s actually left after all expenses — delivery costs, overhead, software, salaries, everything.
Why it matters: This is the truth. You can have a great-looking revenue number and a growing team and still be barely profitable (or not profitable at all). Net Profit is what the business actually produced for you. It’s the number that determines whether you can reinvest, pay yourself well, or weather a slow month.
How to calculate it: Revenue − All Expenses (COGS + Operating Expenses).
The formula:
Revenue − COGS − Operating Expenses
Benchmark to aim for: A healthy agency should be running 15–25% net margin. Below 10% and you’re not building wealth — you’re just staying busy. Over 30%, and you might be leaving growth on the table. 20-25% is the sweet spot.
5. Net Profit Margin
What it is: Your Net Profit expressed as a percentage of Revenue.
Why it matters: Dollar amounts can be misleading as your agency grows. Net Margin gives you the real efficiency picture regardless of your size. A $500k/year agency and a $2M/year agency can both have the same net margin — and that tells you a lot about how well-run they are relative to their scale.
How to calculate it: (Net Profit ÷ Revenue) × 100.
The formula:
(Net Profit ÷ Revenue) × 100 = X%
Benchmark to aim for: 15–25% is the sweet spot for most service agencies. Under 10% means your pricing or costs need work. Above 30% is excellent and usually indicates strong systems and pricing power.
6. Leads
What it is: The number of qualified new business conversations you started in a given month.
Why it matters: Leads are the beginning of your pipeline. Without a consistent, trackable flow of leads, your revenue is entirely dependent on referrals and luck. The goal isn’t to maximize leads — it’s to have enough quality leads to hit your growth targets. Tracking this monthly shows you whether your marketing is working and whether your pipeline is healthy enough to support the growth you want.
How to calculate it: Count every new discovery call, intake form submission, or qualified referral you received in the month. Define “qualified” ahead of time (budget range, service fit, etc.) so you’re measuring apples to apples.
Benchmark to aim for: If you close 40% of leads and your avg deal is $2,500/mo, you need about 3 qualified leads to sign 1 new client — or 5 leads to sign 2.
7. Close Rate
What it is: The percentage of leads you convert into paying clients.
Why it matters: Most agency owners either don’t know their close rate or wildly overestimate it. This number tells you how effective your sales process is. A low close rate means something’s broken — either you’re attracting the wrong leads, your proposal process is weak, your pricing is off, or you need to work on your sales skills. A close rate that’s too high (above 80%) often means you’re not charging enough.
How to calculate it: (New Clients ÷ Leads) × 100, measured over a rolling 3-month window.
The formula:
(New Clients ÷ Leads) × 100 = X%
Benchmark to aim for: 30–50% for most agencies doing consultative sales. If you’re below 20%, your sales process or lead quality needs work. If you’re above 70%, raise your prices.
8. New Clients
What it is: The number of brand new clients that started with you in a given month.
Why it matters: This tells you whether your sales machine is actually converting. It’s the output of your Leads + Close Rate equation. Tracking this monthly helps you spot gaps — a great month for leads followed by a bad month for new clients usually means something went wrong in the sales process.
How to calculate it: Count every new client who signed their first agreement and paid their first invoice in the month.
The formula:
Count of clients who signed in the month
Benchmark to aim for: This depends on your growth goals, churn rate, and avg deal size. If you’re losing 2 clients a month to churn, you need at least 2 new clients just to stay flat.
9. Churn
What it is: The number of clients who left (or the revenue lost from clients leaving) in a given month.
Why it matters: This is the number most agency owners hate to look at. Churn is the silent killer. You can be winning new clients every month and still be shrinking if churn is high enough. High churn usually signals one of three things: misaligned expectations at onboarding, inconsistent results, or scope creep burning out your team. Tracking it forces you to understand why clients leave, not just that they leave.
How to calculate it: Count the number of clients who ended their contract in the month. For Revenue Churn: (MRR Lost to Cancellations ÷ MRR at Start of Month) × 100.
The formula:
(Clients Lost ÷ Total Clients at Start of Month) × 100 = X%
Benchmark to aim for: Under 5% monthly client churn. If you’re losing 3+ clients a month and only winning 2, your business is becoming more fragile no matter what your new revenue looks like.
10. People Cost %
What it is: Your total people costs (salaries, contractor fees, benefits) as a percentage of Revenue.
Why it matters: For most agencies, people are your biggest expense — and the easiest one to let spiral out of control as you grow. People Cost % tells you whether your team is sized right for your current revenue. If this number is creeping up, it usually means you’re over-hiring ahead of revenue, or your team isn’t as utilized as it should be.
How to calculate it: (Total People Costs ÷ Revenue) × 100. Include all employees, contractors, and freelancers doing client or internal work.
The formula:
(Total People Costs ÷ Revenue) × 100 = X%
Benchmark to aim for: 50–65% is typical for most agencies, but the fastest growing agencies keep it below 30%. Above 70% means you’re likely under-resourced on the revenue side or over-staffed on the delivery side — and your profitability will suffer.
11. Avg Client / Mo (Average Revenue Per Client)
What it is: The average monthly value of a client relationship.
Why it matters: This is one of the most powerful levers in your agency. Doubling your average client value has the same revenue impact as doubling your client count — but with the same team, same overhead, and much less stress. If this number is low, you’re likely underpricing, under-scoping, or attracting the wrong clients.
How to calculate it: Revenue ÷ Number of Active Clients.
The formula:
Revenue ÷ Number of Active Clients
Benchmark to aim for: This varies by niche and service type, but generally: if you’re below $1,500/mo per client you’re leaving a lot on the table. Most growing agencies I work with are at $2,500–$5,000+ per client.
12. Avg Client Lifetime
What it is: How long clients stay with you on average, measured in months.
Why it matters: Combine this with Avg Revenue Per Client and you get your LTV (Lifetime Value) — one of the most important numbers in any service business. A short client lifetime means you’re constantly on the hamster wheel of acquisition. A long client lifetime means your revenue is stable, your team is happier, and your business is more valuable.
How to calculate it: Average the length (in months) of all completed client relationships over the last 12 months. Or: 1 ÷ Monthly Churn Rate (as a decimal).
The formula:
1 ÷ Monthly Churn Rate (as a decimal) = X months
Benchmark to aim for: 12+ months is solid. Under 6 months means retention is a serious problem and you need to look hard at your onboarding and results delivery.
13. Average Hourly Yield
What it is: How much revenue your agency generates per hour worked — across your entire team.
Why it matters: This is a measure of your agency’s operational efficiency. It cuts through all the noise and shows you the real output of your team’s time. A low hourly yield means you’re either underpriced, over-servicing, or both. Tracking this over time tells you whether you’re getting more efficient as you grow (which you should be) or whether growth is actually making things worse.
How to calculate it: Revenue ÷ Total Hours Worked by the Team (that month).
The formula:
Revenue ÷ Total Team Hours Worked
Benchmark to aim for: Depends on your service type and pricing, but $75–$150/hour is a healthy range for most agency models. Below $50/hour usually means your pricing model needs a serious look.
14. CAC (Customer Acquisition Cost)
What it is: How much it costs you, on average, to acquire a single new client.
Why it matters: CAC tells you the true cost of your sales and marketing engine. When you pair it with Avg Client Lifetime value, you can tell whether your acquisition model is sustainable. If you’re spending $3,000 to acquire a client whose lifetime value is $4,000, you don’t have much room for error. If your CAC is $500 and your LTV is $8,000, you have a very healthy business.
How to calculate it: Total Sales & Marketing Spend ÷ Number of New Clients Acquired (measured over a 3–6 month rolling window to smooth out fluctuations).
The formula:
Total Sales & Marketing Spend ÷ New Clients Acquired
Benchmark to aim for: Your LTV should be at least 3–5x your CAC. If it’s not, your acquisition costs are eating your profitability.
The Problem: Most Agency Owners Know 2–3 of These Numbers
Maybe revenue. Maybe profit (sort of). Maybe a vague sense of how many clients they have.
But the full picture? Almost nobody has it.
And here’s the thing — you can’t fix what you can’t see. You can’t make smart decisions about hiring, pricing, or growth when you’re working from gut feel and bank balance.
That’s exactly why I built the Agency Growth OS.
It’s the system I use with every agency owner I coach. It pulls all 14 of these numbers into one dashboard, tracks them month over month, and then — here’s the part that makes it different — tells you what to do next based on where the gaps are.
Not just data. Actual direction.
If you want to get your numbers dialed in and finally build an agency that grows without you having to grind harder every month, that’s exactly what we work on together.
Let’s look at your numbers and figure out your next move.